
Power & Grid
PJM in Plain English: The Grid Operator at the Center of Data Center Country
PJM runs the grid across much of the Mid-Atlantic and parts of the Midwest, including one of the world’s densest data center markets. Here is how it works in general terms.

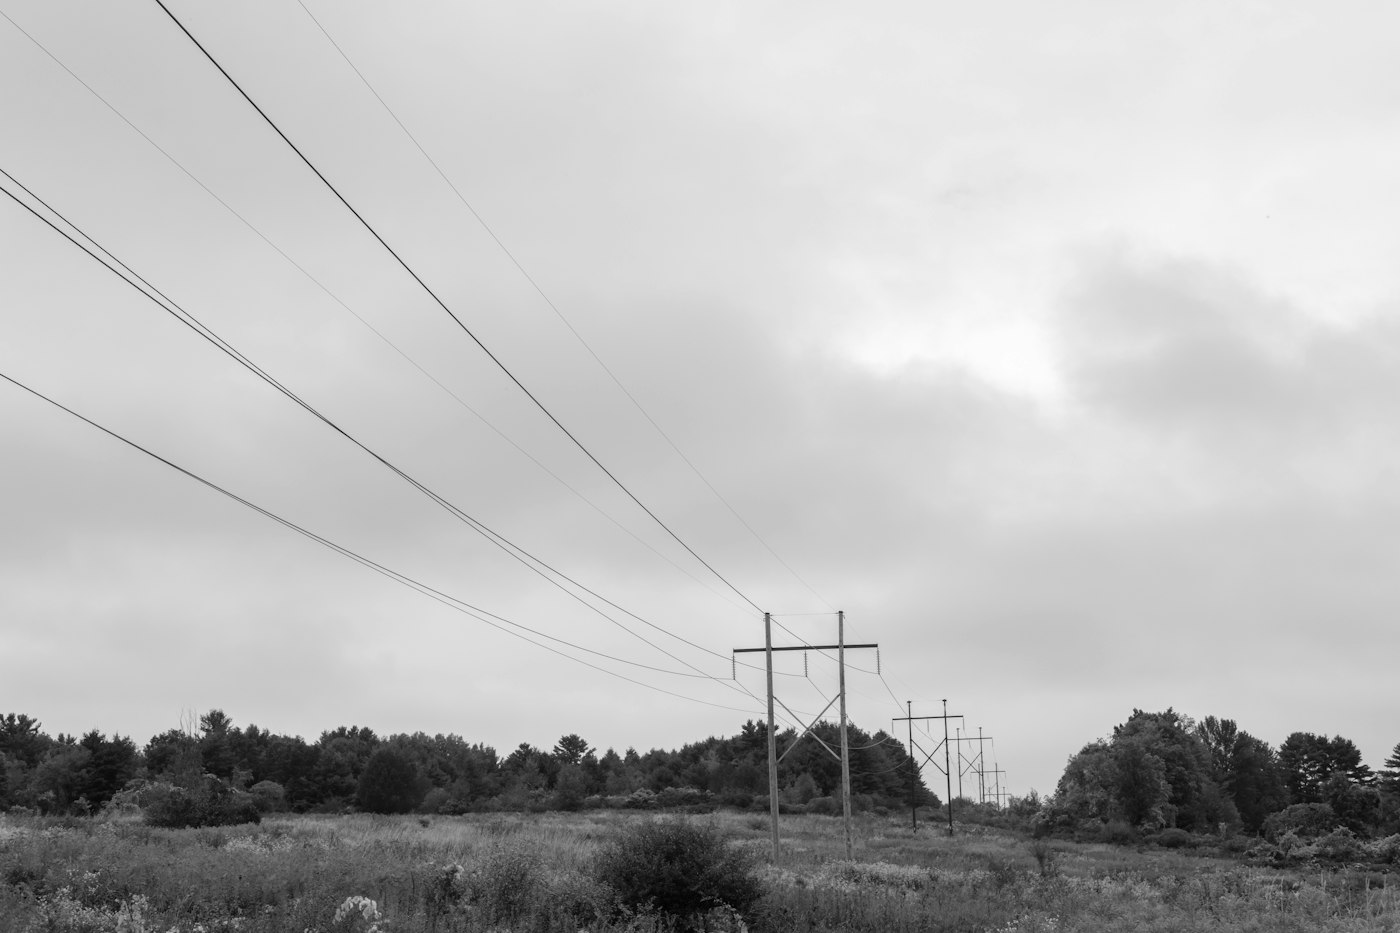
PJM Interconnection is one of the largest grid operators in the world. It coordinates the movement of wholesale electricity across all or parts of thirteen states and the District of Columbia, stretching from the Mid-Atlantic coast into the Midwest. Because its footprint includes Northern Virginia, one of the largest concentrations of data centers anywhere, PJM shows up often in conversations about AI and the grid.
A long history
PJM’s roots go back to 1927, when several utilities in Pennsylvania and New Jersey agreed to pool their power resources. The name originally reflected those states: Pennsylvania, New Jersey and Maryland. Over the decades it grew into an independent organization and became a regional transmission organization under federal rules. Today it is regulated by the Federal Energy Regulatory Commission.
What PJM does
Like other regional operators, PJM:
- Dispatches generators to balance supply and demand across its footprint.
- Runs day-ahead and real-time energy markets with prices that vary by location.
- Procures reserves and other services that keep the grid stable.
- Manages the interconnection queue for new generators.
- Leads regional transmission planning.
PJM does not own power plants or transmission lines. Member utilities and independent companies own those assets, and PJM coordinates their use.
The capacity market
One of PJM’s distinctive features is its capacity market, formally known as the Reliability Pricing Model. Rather than paying only for energy delivered, PJM runs auctions that pay resources to commit to being available in a future delivery year. The goal is to ensure there will be enough generation and demand response to meet peak demand plus a reserve margin.
Capacity auction results are watched closely because they signal how tight the region’s supply is expected to be. When forecast demand rises faster than new supply, auction prices tend to rise, and those costs eventually flow through to customer bills. The details of auction design have been debated and revised many times.
Why data centers matter so much here
Data center growth has become one of the largest drivers of load forecasts in the PJM region. That growth has raised several questions:
- Whether enough new generation can clear the interconnection queue in time.
- How to plan transmission to deliver power to concentrated data center clusters.
- How to allocate the cost of upgrades fairly among customers.
- How to treat data centers located at existing power plants.
These questions involve PJM, its member utilities, state regulators and FERC, and they are being worked out through stakeholder processes and regulatory filings.
Following PJM yourself
PJM publishes a large volume of public information, including long-term load forecasts, interconnection queue data, capacity auction reports and planning documents, at pjm.com. Its independent market monitor also publishes regular reports on market performance. For anyone trying to understand how data center growth is affecting the region, these primary documents are more reliable than secondhand summaries, and they explain the assumptions behind the numbers.
How a Capacity Auction Works, in Simple Terms
The capacity market can sound abstract. Walking through the general logic of an auction makes it easier to follow headlines about results.
- Set the target. PJM forecasts peak demand for a future delivery year and adds a reserve margin to cover unexpected outages. That produces the amount of capacity the region wants to secure.
- Collect offers. Power plants, batteries, demand response providers and other eligible resources offer to commit their capacity at a price.
- Build a demand curve. Rather than buying a single fixed amount, the auction uses a sloped curve. When supply is plentiful, the price falls and slightly more capacity may be bought. When supply is scarce, the price rises.
- Clear the auction. Offers are stacked from lowest to highest price. Where supply meets the demand curve sets the clearing price, which most resources in an area receive.
- Account for location. Some zones with transmission limits may clear at different prices than the rest of the region.
- Deliver and perform. Resources that clear are obligated to be available during the delivery year and can face penalties if they fail to perform during emergencies.
Capacity costs are then passed along to utilities and retail suppliers, and eventually into customer bills through state rate processes.
What to Watch in PJM Reports
For readers following data center growth in the region, a few documents and figures are especially telling:
- The long-term load forecast. Look at how forecast peak demand changes from one year’s report to the next, and how much of the change the report attributes to large loads.
- Interconnection queue status. Compare how much new generation is merely requested against how much has signed agreements or is under construction.
- Deactivation notices. Planned retirements of existing plants reduce supply and can trigger reliability studies.
- Transmission plans. Regional plans list projects meant to deliver power to growing load centers, along with estimated in-service dates.
- Market monitor reports. These often explain what drove price changes and flag design concerns.
Common Misreadings
Treating the capacity price as the electricity price
Capacity payments are one part of total wholesale costs. Energy prices, transmission charges and other services also matter, so a capacity price change does not translate one for one into a bill change.
Assuming every forecast megawatt arrives
Load forecasts carry uncertainty. Some planned data centers will be delayed, downsized or moved, and forecasts are revised as projects firm up or fall away.
Questions Readers Ask
Why is Northern Virginia so concentrated? The area developed dense fiber networks and a large ecosystem of data center operators early, and clustering tends to attract more facilities.
Can demand response compete in the capacity auction? Yes, eligible demand resources can offer capacity, subject to PJM’s performance rules.
Who decides changes to auction rules? Proposals go through PJM’s stakeholder process and must be approved by FERC. This is general education and not investment advice.
Does a higher capacity price mean the grid is unreliable? Not by itself. It signals that the margin between expected supply and expected demand has narrowed, which encourages new resources to come forward and existing ones to stay. Whether reliability is at risk depends on how the region responds over the following years.
How far ahead are auctions held? The design aims to procure capacity several years before the delivery year, giving developers time to build. Schedules have shifted at times as rules were revised.
Where does the money go? Capacity payments flow to the resources that cleared the auction, helping cover their fixed costs such as staffing, maintenance and financing, which energy sales alone may not fully recover.
Latest stories
View all


Power & Grid
A Maintenance Window Changes the Meaning of Redundancy
A facility’s normal arrangement is only one of its operating states. When equipment is removed from service for maintenance, the remaining paths may carry a different risk. A redundancy label needs to be read with that temporary configuration.
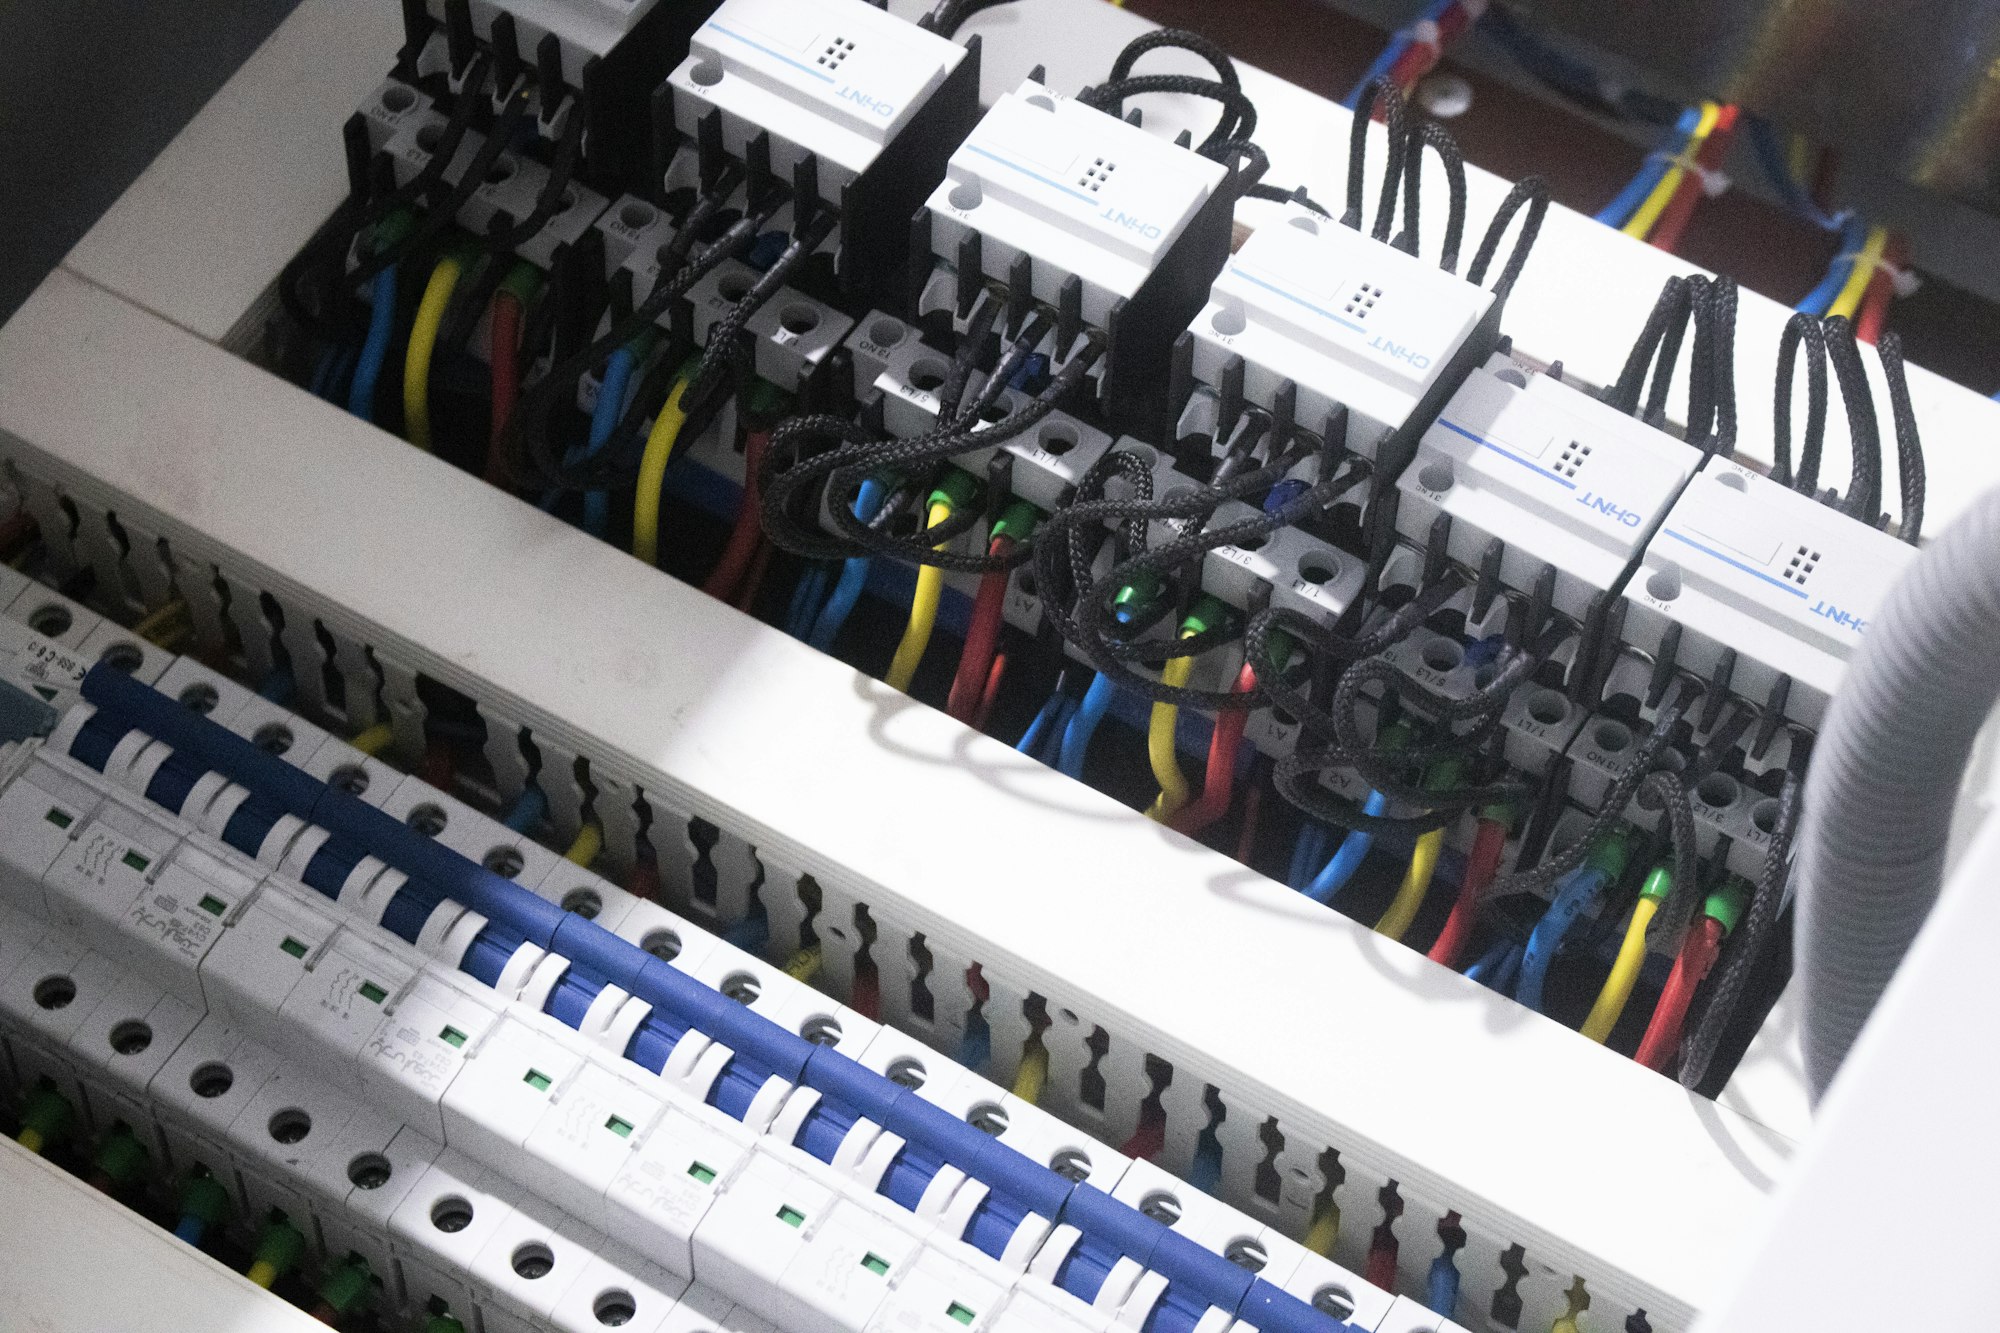
Photo: mostafa mahmoudi / Unsplash
A facility's normal arrangement is only one of its operating states. When equipment is removed from service for maintenance, the remaining paths may carry a different risk. A redundancy label needs to be read with that temporary configuration.
The operating distinction
Maintenance can remove a spare component, change a transfer path or increase the load on equipment that remains available. The operational question is which further interruption the system could tolerate in that state. That question may have a different answer from the one given for normal operation.
Temporary states deserve names that operators can recognize. If a system has several possible maintenance configurations, a generic instruction to use the backup can leave too much unstated. The arrangement being discussed should match the equipment actually removed from service.
A practical example
Imagine a hypothetical system with alternate power paths while both are available. During planned work on one path, the other becomes more important. A second task on a related component could create an exposure that neither maintenance activity would create alone.
Questions worth asking
The temporary configuration changes the relevant failure question. Describing the available paths during maintenance helps readers understand both why the work is necessary and which additional conditions the operating team must manage around it.
- What protection remains while the selected equipment is unavailable?
- Could another planned activity affect the same remaining support path?
- What condition would postpone the work or require restoration of the normal arrangement?
What the evidence supports
This does not mean that maintenance should be avoided. Deferred work can increase other risks. It means that timing, dependencies and contingency arrangements belong in the planning discussion. Only qualified personnel following the site's procedures should operate or isolate electrical equipment.
The communication record should also identify when the temporary condition begins and how normal status is restored. Otherwise the next shift may inherit a narrower margin without realizing it. In a public explanation, this can remain high-level: the purpose is to distinguish resilience under normal conditions from resilience during planned work, not to publish sensitive switching instructions or suggest that every maintenance activity creates the same risk.
Describe resilience during the actual maintenance state, rather than borrowing the normal-state label without qualification.
Quick check
How much did you catch? Tap a question to see the answer.
1. Why read a redundancy label alongside maintenance plans?
Answer: Taking equipment out of service changes the risk on the paths that remain.
2. What question matters during maintenance?
Answer: Which further interruption the system could tolerate in that temporary state.
3. Why is “use the backup” too vague?
Answer: It doesn’t say which configuration matches the equipment actually removed from service.
Thinking in Operating States
A helpful habit is to describe a system as a set of named operating states rather than a single design. Each state has its own available paths and its own answer to the question of which further failure it could tolerate. In general terms, a facility might move through states such as these:
- Normal. All designed paths and spare components are available.
- Planned maintenance. A specific component or path is intentionally out of service for work.
- Degraded after a fault. A component has failed unexpectedly and the system is running on the remaining paths.
- Testing. The system is deliberately placed in a configuration to confirm that a function works.
- Restoration. Work is complete and the system is returning to normal, but checks are not yet finished.
Describing which state applies, and what remains available in it, gives operators and readers a shared language. It also makes clear that the same facility can have different resilience at different times of the same week.
Planning a Maintenance Window Step by Step
The following outline describes how a planning discussion can be structured. It is not a switching procedure, which belongs to qualified personnel and site-specific methods.
- Name the affected equipment and resulting state. State clearly what will be out of service and what the remaining arrangement will be.
- Identify what remains protected. Describe which further faults the remaining paths could tolerate.
- Check for overlapping work. Review other planned activities, supplier visits and tests that could affect the same remaining path.
- Consider external conditions. Weather forecasts, utility notices and unusual load periods may favor a different timing.
- Set stop conditions. Agree in advance which developments would pause the work or trigger a return to the normal arrangement.
- Communicate the window. Inform affected teams and customers as appropriate, including start, expected end and restoration checks.
- Confirm restoration. Verify that normal status has returned and record it so the next shift knows.
Common mistakes
Two unrelated teams scheduling work on components that share a dependency is a classic problem, especially when change records are kept in separate systems. Another mistake is leaving a temporary state in place longer than planned without updating the shift record. A third is treating the restoration as complete as soon as equipment is energized, before checks confirm that the redundant path is genuinely available again.
What This Means for Customers and Readers
For a business hosted in a facility, maintenance notices are an opportunity to understand how resilience changes during planned work. A provider that explains the temporary state, the remaining protection and the stop conditions is communicating useful information. For readers following the industry, a redundancy label describes design intent; operating practice determines how well that intent holds up across the year.
Redundancy is a property of a particular moment, not a permanent label on the building.
Questions Readers Ask
Why not simply avoid maintenance to keep redundancy intact?
Deferred maintenance can increase the chance of unplanned failures. Planned work is usually the safer path when it is scheduled and coordinated carefully.
Can a facility remain fully redundant during maintenance?
Some designs are built to keep a spare path available while one path is under maintenance. Whether that applies depends on the specific design and the work involved.
Should customers be told about maintenance windows?
Many agreements include notification arrangements. The details vary by provider and contract.
What is a stop condition?
A pre-agreed event or reading that pauses the work or triggers restoration of the normal arrangement.
AI infrastructure explainers and news on iPhone, iPad and Apple Watch.
Power & Grid
Draw the Outage Boundary Before Comparing Backup Power
A backup-power claim becomes easier to understand when its boundary is drawn on a simple diagram. Keeping a server powered is different from keeping an entire service available, and neither statement describes every possible interruption.
Photo: imgix / Unsplash
A backup-power claim becomes easier to understand when its boundary is drawn on a simple diagram. Keeping a server powered is different from keeping an entire service available, and neither statement describes every possible interruption.
The operating distinction
Electricity reaches the application through equipment with different jobs. A battery may support the server while a generator starts, yet the cooling controls, network equipment or building pumps could depend on another circuit. If any necessary part loses power, the application can stop even when its own power supply remains healthy.
The boundary also determines what an availability statement leaves out. A supplier may describe its equipment accurately while a customer reasonably hears a promise about the application. Those interpretations should be reconciled before a purchase or acceptance discussion.
A practical example
Consider a hypothetical hall with battery-backed racks and a cooling pump outside that protected boundary. A short interruption could leave the processors running while coolant circulation stops. The useful question is how the whole service behaves during that interval, rather than whether the rack has a battery.
Questions worth asking
An availability promise becomes clearer when the protected equipment and the promised user outcome are named together. Otherwise different parties can agree on the words while assuming different boundaries around the service.
- Which supporting systems sit outside the protected power boundary?
- What happens while the system transfers between power sources?
- Which test demonstrates the claimed application-level behavior?
What the evidence supports
A drawing is not proof of performance. Actual protection depends on the installed arrangement, controls, maintenance state and tests. Two facilities using the same redundancy label can have different dependencies and different opportunities for a shared failure.
One useful reading exercise is to trace an ordinary user request through the drawing and mark every system it needs. Then consider an interruption at each boundary. This is a discussion exercise, not permission to disconnect equipment. It helps reveal which claims depend on assumptions that have not yet been stated and which supporting systems need evidence of their own before the broader service claim can be understood.
Define the service first, then examine the electrical and mechanical chain that keeps that service running.
Quick check
How much did you catch? Tap a question to see the answer.
1. Is keeping a server powered the same as keeping a service available?
Answer: No. Cooling, networking and building systems can sit on other circuits.
2. What helps make a backup-power claim clear?
Answer: Drawing its boundary on a simple diagram.
3. What can happen if a cooling pump sits outside the protected boundary?
Answer: Processors keep running while coolant circulation stops.
Going Deeper: Drawing the Diagram Step by Step
The exercise described above works best with a plain sheet of paper and a simple method. Here is one way to build the drawing for a hypothetical service before any comparison of backup power begins.
- Name the service outcome. Write one sentence at the top describing what users must be able to do, for example “customers can submit and receive answers within the agreed response time.” Everything else on the page exists to support that sentence.
- List the systems the request touches. Servers, storage, network switches, firewalls, the cooling loop serving those racks, the controls that run the cooling, and any building systems such as pumps or ventilation that the room depends on.
- Mark each system’s power source. Note which ones sit on battery-backed circuits, which rely on generator support only, and which run on ordinary utility power.
- Draw the boundary. Circle everything protected by the backup arrangement under discussion. Anything outside the circle is a dependency the claim does not cover.
- Walk through the transfer. For each system, ask what happens in the seconds between a utility interruption and the backup source taking over, and again when power returns.
- Note the evidence. Beside each system, write what test, document or record shows how it behaves. Blank spaces become the questions to ask.
Why the transfer interval deserves its own line
Batteries and generators do different jobs on different timescales. The battery carries the load immediately; the generator needs time to start and stabilize. Equipment that rides through the first interval may still be affected if it loses support during the second, or if controls reset when the source changes. Writing the sequence down makes those moments visible instead of assumed.
Common Gaps the Diagram Tends to Reveal
- Cooling controls on a separate circuit. Chillers or pumps may be backed up, but the controllers that tell them what to do might not be.
- Network equipment outside the protected room. A switch or router in another closet can become the single point that takes the service offline.
- Shared upstream components. Two “redundant” paths that pass through one panel, one transfer switch or one fuel supply can fail together.
- Monitoring that depends on the thing it monitors. If alarms run through systems that lose power, operators may not learn of a problem until users do.
- Restart behavior. Some equipment does not return to normal operation automatically when power is restored and may need manual steps.
Questions to Bring to a Supplier or Facility Conversation
- Which of the systems on our drawing does your claim cover, and which does it exclude?
- Is the stated availability measured at the equipment, the room or the service?
- What recent tests exercised the full transfer sequence, and what did they show?
- How are maintenance periods handled, when part of the protection may be out of service?
- Who is responsible for dependencies that sit between your scope and ours?
Questions Readers Ask
Is a redundancy label enough to compare two facilities? As noted above, the same label can describe different arrangements. The drawing and the evidence behind it are what make a comparison meaningful.
Who should draw the diagram? Ideally the people responsible for the service and the people responsible for the facility, together, so that assumptions on both sides end up on the same page.
Does this apply to small server rooms too? Yes. A single rack with a battery unit in an office can still depend on an unprotected air conditioner or network closet, so the same drawing exercise is useful at any scale.
How often should it be updated? Whenever equipment, layout or the service itself changes. A drawing that no longer matches the installed arrangement can be more misleading than none at all.
AI infrastructure explainers and news on iPhone, iPad and Apple Watch.
Power & Grid
FERC’s Large-Load Orders: The November 16 Grid Deadline Behind the AI Build-Out
FERC told all six grid operators it regulates to justify or rewrite their rules for connecting data centers and other large loads. After extensions, the answers are due November 16. Here is what to watch.
For most of the AI build-out, the hard question about a new data center has been about hardware: can the operator get the accelerators, the transformers and the cooling equipment? A slower question sits underneath all of them. Who decides how a 300-megawatt customer connects to the transmission grid, how long the study takes, and who pays if the project never arrives?
On June 18, 2026, the Federal Energy Regulatory Commission put that question to every grid operator it regulates. It issued six show cause orders, one each to PJM, MISO, SPP, CAISO, ISO New England and NYISO. Each order tells the operator and its transmission owners to either prove their current rules for large loads are just and reasonable or file new ones. After extensions, the responses are now due on November 16, 2026, for five of the six regions and November 20 for SPP.
This article explains what FERC asked for, where each step stands, and what the filings will tell readers following AI infrastructure.
How the grid got here
Generators that connect to the transmission grid have long had a federal process: a queue, studies and a standard agreement. Large consumers of electricity mostly did not. A new factory or data center usually connected through its local utility under rules set largely by states. That arrangement worked when a large industrial customer meant tens of megawatts. It strains when single campuses ask for hundreds of megawatts, sometimes with their own generation on site.
In October 2025 the Secretary of Energy used his authority under the Department of Energy Organization Act to send FERC an advance notice of proposed rulemaking on large-load interconnection, opened as Docket No. RM26-4-000. FERC says its staff reviewed more than 3,500 pages of public comments. Rather than issue a single national rule, the Commission chose tailored orders under Section 206 of the Federal Power Act, region by region. The rulemaking docket remains open.
FERC staff’s explainer describes the orders as covering facilities with maximum demand of at least 20 megawatts. They build on two earlier actions: a December 2025 order directing PJM to adopt transparent tariff rules for load co-located with generation, and FERC’s approval of SPP’s High Impact Large Load process.
The five issues every region must answer
Each order is tailored to its region, but all six identify the same five areas for reform:
- Faster, clearer study processes. A defined application path for large loads with accelerated study timelines, including evaluation of grid-enhancing and alternative transmission technologies.
- No cost shifting. Rules that keep upgrade costs for new large loads from landing on other customers, and public transparency into what those upgrades cost.
- Co-location and behind-the-meter generation. Clear tariff rules for data centers built next to, or behind the meter of, a power plant.
- Services for flexible loads. New transmission products, such as non-firm or contract-demand service, for customers willing to curtail during grid stress.
- Studying generation and load together. A process to study new generation alongside the nearby or co-located load it is built to serve.
The second item may matter most for public acceptance. FERC preliminarily found that operators do not publicly post enough data on the upgrades and costs needed to serve new large loads. The remedies it floated include posting each upgrade’s scope, cost and cost assignment, plus a central cost-transparency page on each operator’s website. FERC also asked whether operators should adopt standard cost recovery agreements among the grid operator, the transmission owner and the large customer. Those agreements would protect other ratepayers if a project is canceled or leaves early.
Two limits are easy to miss. The findings are preliminary, and FERC staff note the orders do not impose new transmission rates. The orders also apply going forward. FERC said they are not meant to disturb existing agreements or negotiations already near completion.
Where the clock stands
The orders set two deadlines. Within 30 days, each region had to file an informational report on how it will keep enough generation for existing and new large loads. MISO, for example, filed its report on July 20. Within 60 days, each region had to file its tariff response, unless it asked FERC to pause the case.
The operators asked for that pause, and FERC staff now list November 16 as the response date for five regions and November 20 for SPP. CAISO’s August 3 motion requested a 90-day abeyance so it could build a tailored filing with its transmission owners through an accelerated stakeholder process. MISO and its transmission owners filed a similar request the same day, and MISO reports that FERC granted it on August 14. In MISO’s case, responses are now due November 16 and answers to those responses December 16.
The pause has limits. CAISO’s motion notes that FERC said it would not grant abeyances reflexively. FERC capped them at 90 days and said it would look with great disfavor on requests to extend them further. That makes November 16 a firmer date than regulatory deadlines often are.
Some regional work is moving on a parallel track. CAISO’s published schedule takes its large-load proposal to its Board of Governors on October 28, ahead of the FERC filing. MISO separately filed interconnection reliability requirements for large loads on August 28, asking for a December 4 effective date.
What the filings will reveal
The responses will be long and technical. A handful of questions will say most of what matters about how quickly new AI capacity can connect, and on what terms.
- Study timelines. Does each region commit to a defined number of days for a large-load study, and what readiness deposits or milestones must a project show to keep its place?
- Interim service. Can a data center take non-firm or as-available service while network upgrades are built, and how often could that service be curtailed?
- Financial security. How much must a large customer commit up front, and what happens to that money if the project shrinks or is canceled?
- Co-location rules. How will regions treat a campus that sits beside a power plant, and what share of grid costs does it carry?
- Cost posting. Will upgrade costs be published per project, so state regulators and the public can see who pays?
The answers will likely differ by region. A region that offers a fast, well-defined path with clear collateral rules may attract projects that can meet those terms. A region whose answers stay open-ended may keep seeing projects wait in queues and bilateral negotiations. Readers should treat any claimed speed-up with care until the tariff language is approved and the first projects move through it.
The orders also leave a gap. Utilities outside the six RTO and ISO regions, including much of the Southeast and West, are not directly covered. FERC Chairman Laura Swett encouraged those transmission providers to pursue similar reforms through their own filings. ERCOT, which runs most of the Texas grid, is not subject to the orders.
Why this belongs on an AI-infrastructure watch list
BOSSTOX has covered the physical limits on AI capacity: transformer lead times, transmission and local grid upgrades, behind-the-meter generation and on-site storage. The FERC proceeding is the rulebook that ties those pieces together. It decides how a project enters the grid, which upgrades it triggers, and who carries the risk if forecast demand does not arrive.
The dates to watch are concrete: CAISO’s board meeting on October 28, the six responses due November 16 and 20, answers due in mid-December, and the FERC orders that follow. BOSSTOX will review the filings once they are posted and report what each region actually committed to.
This article is general information about a regulatory proceeding. It is not investment, legal or regulatory advice. Filing dates come from FERC and grid-operator documents and may change; check the dockets for the latest.
Sources
- FERC, “FERC Launches Aggressive Targeted Action to Speed Large Load Integration,” June 18, 2026: ferc.gov
- FERC Office of Public Participation, “Cost Transparency and Customer Protection Initiatives in FERC’s June 2026 Show Cause Orders for Large Load Interconnections”: ferc.gov
- California ISO, “Motion for Abeyance,” Docket No. EL26-71-000, August 3, 2026: caiso.com
- MISO, “Large Load Working Group FERC Status Report,” September 9, 2026: misoenergy.org
- Akin Gump, “FERC Issues Landmark Show Cause Orders on Large Load Interconnection,” June 2026: akingump.com
BOSSTOX Research articles are drafted with AI assistance and reviewed by our editors before publication. See our editorial standards.

A Coolant Distribution Unit Needs Its Own Power-Loss Story

The Control Plane Can Be a Shared Dependency Across Separate Systems

A Maintenance Window Changes the Meaning of Redundancy

Remote Support Depends on More Than a Telephone Number

Transformer Lead Times Are Becoming a Data-Center Schedule Risk

Gas Turbines on Data-Center Campuses

Water Use and Dry Coolers: The Tradeoff AI Sites Cannot Avoid

Battery Storage at AI Sites
A Coolant Distribution Unit Needs Its Own Power-Loss Story
The Control Plane Can Be a Shared Dependency Across Separate Systems
A Maintenance Window Changes the Meaning of Redundancy
Remote Support Depends on More Than a Telephone Number
-
 Power & Grid1 month ago
Transformer Lead Times Are Becoming a Data-Center Schedule Risk
-
 Power & Grid1 month ago
Gas Turbines on Data-Center Campuses
-
 Cooling2 months ago
Water Use and Dry Coolers: The Tradeoff AI Sites Cannot Avoid
-
 Power & Grid1 month ago
Battery Storage at AI Sites
-

 Compute & Silicon1 month ago
GPU Supply Chains: How AI Hardware Gets Made, Moved, and Bottlenecked
-

 Power & Grid4 weeks ago
FERC’s Large-Load Orders: The November 16 Grid Deadline Behind the AI Build-Out
-

 Capital & Backlog4 weeks ago
AI Infrastructure’s Rough Week: Chips Fall 6.7% as Meta Lifts Capex Floor
-

 Cooling4 weeks ago
Liquid-Cooling Leak Detection and Reliability